
Summary
We haven’t been updating this blog much since early 2014 when we first published our climate science findings. However, while the blog hasn’t been very active, we have been very busy continuing our climate research, discussing our findings with climate scientists around the world and collaborating with other researchers. So, we thought we should write a short post to let you all know how we’ve been getting on since 2014.
While the public are still being inundated with claims that “the science is settled”, and that “climate change is man-made and dangerous”, our own experience since we’ve started discussing our findings has mostly been one of encouragement and appreciation from the scientists we’ve met. Most of the scientists we’ve met are usually very interested in our findings, and happy to discuss our work. In this post, we will provide some brief observations on what we’ve found from our discussions.
We also include a brief summary of two new papers we’ve published since 2014:
1. W. Soon, R. Connolly & M. Connolly, 2015. Re-evaluating the role of solar variability on Northern Hemisphere temperature trends since the 19th century. Earth-Science Reviews. Vol. 150, 409-452. (Abstract; Preprint)
2. R. Connolly, M. Connolly & W. Soon, 2017. Re-calibration of Arctic sea ice extent datasets using Arctic surface air temperature records. Hydrological Sciences Journal. In press. (Abstract; Preprint)

What we’ve been doing since 2014
Because we don’t receive any funding for our climate research, most of our time has gone into our other research projects, e.g., developing more sustainable, environmentally-friendly and ethical approaches to fish farming; designing cheap and efficient methods for heating, heat transfer and heat storage; wastewater treatment; consultancy; etc. Imelda also took some time out to focus on a passion of hers (traditional Irish music) and completed a Masters degree in ethnomusicology at the University of Sheffield, UK.
However, aside from that, much of our spare time has gone into continuing our climate research as well as discussing our findings with other scientists around the world. Whenever we’ve had the chance, we’ve been discussing each of our eight OPRJ papers with scientists with direct expertise in the topics of the papers. Most of the scientists we have met and/or communicated with have been very supportive of our research, and when they have specific expertise on one of our research topics, they’ve usually agreed with our analysis of that particular topic.
We have also been collaborating with some of the researchers we’ve met on various climate science projects. Although we believe the future of peer reviewed research should be with open peer review systems, such as our Open Peer Review Journal, researchers are still using the conventional closed peer review systems. So, when we are collaborating with others, if our co-authors want to stick to the conventional system, we have been using closed peer review journals.
Two of these collaborative papers have already been published (both with Dr. Willie Soon from the Harvard-Smithsonian Center for Astrophysics):
- W. Soon, R. Connolly & M. Connolly, 2015. Re-evaluating the role of solar variability on Northern Hemisphere temperature trends since the 19th century. Earth-Science Reviews. Vol. 150, 409-452. (Abstract; Preprint)
- R. Connolly, M. Connolly & W. Soon, 2017. Re-calibration of Arctic sea ice extent datasets using Arctic surface air temperature records. Hydrological Sciences Journal. In press. (Abstract; Preprint)
We are currently working on several more collaborative papers with different groups – each looking at different aspects of our climate research, and several of them building on our earlier findings.
Scientists’ views on climate change – our observations
As we discussed in an earlier post, we have found that there is a wide spectrum of opinions on man-made global warming/climate change among the scientific community. Despite this, a lot of people (sometimes high profile) seem convinced that e.g., “97% of scientists believe climate change is entirely man-made and dangerous”. For example, here’s a 2013 Tweet from the then-US President, Barack Obama:
Part of the problem seems to be that for many people the terms “climate change” and “global warming” have become synonymous with “human-caused climate change from greenhouse gas emissions”. This incorrectly implies that climate change can only occur through human activities.
Prof. Roger Pielke, Jr. (2005) has suggested that this is partly due to the fact that the UN’s Framework Convention on Climate Change (UN FCCC) define climate change as “a change of climate which is attributed directly or indirectly to human activity that alters the composition of the global atmosphere and which is in addition to natural climate variability over comparable time periods”. That is, according to the UNFCCC definition, there is no such thing as “natural climate change”. This definition is widely used at the UN’s annual international Conference Of the Parties (COP) meetings.
On the other hand, most scientists, including the UN’s Intergovernmental Panel on Climate Change (IPCC), use more scientifically robust definitions than the FCCC. The IPCC define “climate change” as “any change in climate over time whether due to natural variability or as a result of human activity”. That is, climate change can be either human-caused, natural or both. See Pielke, R.A. Jr., 2005 for a more detailed discussion (Abstract; see Google Scholar for preprints).
There have been a number of surveys of the views of the scientific community on climate change. In Figures 1 and 2, we have summarised the results from four of the main surveys: Maibach et al., 2016 (pdf); Doran & Zimmerman, 2009 (Open access); Verheggen et al., 2014 (Open access); Farnsworth & Lichter, 2012 (Abstract; Google Scholar).
There are two distinct issues:
- (a) Does climate change?
- (b) Is recent climate change human-caused or natural?

We can see that, yes, more than 90-95% of scientists agree that the climate changes and/or that global temperatures have increased since the relatively cold 19th century, i.e., that there has been “global warming” – see Glossary. This finding has been widely reported by the media, and we also agree with both of these statements.
However, as can be seen from Figure 2, there is ongoing debate among the scientific community over whether the recent climate change is mostly natural or mostly human-caused. Many scientists believe that at least some is human-caused, but many also believe that at least some is natural.

By conflating the weak consensus that “more than 90-95% of scientists agree there is climate change”, with the UN FCCC’s political definition of “climate change”, many people have gotten the mistaken idea that more than 95% of scientists believe climate change is entirely human-caused (as former US President Obama did in his tweet above).
Certainly there are quite a few scientists who believe climate change is entirely human-caused – as can be seen from Figure 2. So, climate campaigners promoting this claim can easily find scientists to endorse this one-sided view of the science. But, as we discussed in our 2013 post on this claim, there is actually a wide range of views among the scientific community on how much of the global warming since the late 19th century is human-caused and how much is natural.
In our discussions with other scientists since 2014, we have found that most scientists are actually quite open to persuasion on the “mostly man-made vs. mostly natural” issue. At this stage, most scientists (like most of the public) have formed their own opinion on this issue, but if they are presented with scientific evidence which goes against their opinion, they’re usually prepared to change their mind.
Why is there such a wide range of views among the scientific community on the “mostly man-made” vs “mostly natural” issue? If the evidence for/against these views is so ambiguous, why do so many scientists have such strong views on this? It’s a tricky question – there seem to be many different factors.
But, from our discussions with other scientists we have found that the following factors are surprisingly important:
- Models vs. Observations. We’ve found that, in general, scientists who believe global warming is “mostly man-made” tend to place a greater emphasis on the results from computer models, while those who believe global warming is “mostly natural” tend to be more concerned with the results from actual experimental observations.
- Over-specialisation. Unfortunately, the current academic system puts a lot of pressure on scientists to find a relatively narrow field of research to specialise in, and then stick to that topic. This means that experts in a very specific aspect of climate science (e.g., Arctic sea ice trends, climate model projections, carbon dioxide emissions, dynamic meteorology) often feel very uncomfortable assessing aspects outside of their specific field of research. With that in mind, we have noticed that generally speaking, many of the “mostly natural” scientists have worked on several different aspects of climate science, while “mostly man-made” scientists tend to stick to just one or two aspects.
- Group-think. Although scientists are supposed to be objective in their analysis, we are still prone to the same biases as everyone else. In particular, confirmation bias means that everyone (including scientists) has a natural tendency to be overly dismissive of results that disagree with our personal views and overly accepting of results that match our prior expectations. In particular, we’ve found that many “mostly man-made” scientists haven’t even read the papers of “mostly natural” scientists and vice versa!
- Left vs. Right. Multiple surveys of the public have consistently found that liberals are much more likely to believe global warming is “mostly man-made”, while conservatives are much more likely to believe global warming is “mostly natural”. Prof. Dan Kahan has shown that this partisan issue becomes even bigger among people who have studied the topic. That is, the more a liberal knows about climate science, the more convinced they are that it’s “mostly man-made”, while the more a conservative knows about climate science, the more convinced they are that it’s “mostly natural”! See Kahan, 2015 (Abstract; Preprint) for more. We’ve noticed that this trend seems to even apply to climate scientists – many of the scientists we’ve met who are most convinced it’s “mostly man-made” are strongly left-wing in out-look, while many of the “mostly natural” scientists are politically conservative.
[For what it’s worth, all three of us are politically quite left-wing, yet we’ve concluded that it’s “mostly natural”. So, obviously political views aren’t the only factor in a scientist’s views on climate change. But, political ideology does seem to be a very big factor.]
Climate conspiracy theories – “Big Oil” vs. “Big Green”
While we were working with Dr. Willie Soon on our 2015 paper, he came under attack from a former Greenpeace campaigner, Kert Davies, who claimed to have discovered evidence that Willie was supposedly working on behalf of the fossil fuel industry. Willie is one of the climate scientists who believes global warming is “mostly natural”, but Kert Davies was implying this was not for scientific reasons, but part of some nefarious conspiracy to make more money for the fossil fuel industry.
Having worked with Willie, we can say categorically that Kert Davies’ conspiracy theory is utter nonsense. But, because his conspiracy seemed to make sense to people who believe global warming is “mostly man-made”, his claims were uncritically reported by several prominent newspapers, e.g., The Boston Globe, New York Times and The Guardian.
For Willie’s side of the story, here is a statement he issued after Davies published his claims, and here is a detailed summary of the relevant facts.
The attack on Willie seems to be part of an ongoing campaign on behalf of various NGOs and organisations running campaigns based on “climate action”, such as Greenpeace, Friends of the Earth and Union of Concerned Scientists to try and discredit any prominent scientist who disagrees with their views on climate change. As part of their fundraising campaigns, they heavily rely on their claim that 97% of scientists agree with them that climate change is entirely man-made, e.g., here, here or here.
Many of these campaigns are very successful, e.g., in 2014, Greenpeace International’s total income was €296 million and in 2013, their total income was €288 million – see Greenpeace’s annual report 2014, p29. So, it is very inconvenient for them whenever a prominent scientist publicly makes an argument for the “mostly natural” case.
For this reason, “climate action” groups like to claim that those scientists who disagree with them are merely the fringe 3% of “climate deniers” who disagree with the remaining 97% of scientists. As we saw in the section above, this is false – the 97% figure refers to whether or not climate changes, not how much is man-made vs. natural. Additionally, Kert Davies and others have been actively working to discredit each of the most influential “mostly natural” scientists through smear campaigns, like the one on Willie. These campaigns rely mostly on innuendo and cherry picking evidence, e.g., see this critique by Russell Cook.
They also are often remarkably hypocritical and sometimes seem to be examples of the black pot calling the white kettle, “black”! For instance, Dr. Steven Allen, the vice president of one of the think tanks targeted by one of these smear campaigns, i.e., Brulle, 2014 (Abstract; link to Google Scholar versions) has looked critically at the Brulle study in his “Climate dollars” paper. Allen argues that if Brulle, 2014 had applied the same analysis to both sides of the debate, he would have found that, ”…the funding of Brulle’s allies dwarfed that of his foes, whom Brulle tried so hard to depict as having unmatched control over the public’s view of climate science”.
At any rate, the two papers we’ve published with Willie were carried out during our own free time and at our own expense. None of us received any funding for either of these studies.
SCC2015 – Re-evaluating the role of solar variability on Northern Hemisphere temperature trends since the 19th century
Our first paper with Willie was: W. Soon, R. Connolly & M. Connolly, 2015. Re-evaluating the role of solar variability on Northern Hemisphere temperature trends since the 19th century. Earth-Science Reviews. Vol. 150, 409-452. (Abstract; Preprint)
Supplementary Information for the paper can be found at FigShare.
For those of you who want a video summary, Willie gave a ~20 minute preview of our key findings at a presentation in June 2015:
The paper is quite a long review article, since we were reviewing and assessing two particularly contentious topics:
- Solar variability: how has the Sun’s output varied since the 19th century and have there been any long-term trends?
- Global temperature trends: are there any non-climatic biases remaining in the standard “global warming” estimates, and if so can we correct for them?
According to the Intergovernmental Panel on Climate Change (IPCC)’s most recent (2013) Working Group 1 report, the Sun’s output has remained relatively constant since the mid-20th century and if anything has decreased. They also claim that the standard global temperature estimates are quite reliable and that any non-climatic biases remaining in the data are very small (even negligible). So, when the IPCC compared the output of their climate models (CMIP5) to the global temperature datasets, they concluded with greater than 95% confidence that “human influence has been the dominant cause of the observed warming since the mid-20th century”. See our earlier post here for more details.
However, in our review we showed that there were serious problems with both of these claims.
First, we found that the CMIP5 climate models used by the IPCC had only considered a small subset of the available solar variability datasets published in the scientific literature. Coincidentally, all four of the solar datasets which were used by CMIP5 climate models implied very little solar variability since the 19th century and a slight decrease in recent decades.
In Figure 3, we compare some of the “high solar variability” datasets out there (left hand side) with the “low solar variability” datasets used by the CMIP5 (right hand side):

From Figure 3 we can see that if the climate models used by the IPCC had used some of the high solar variability datasets, they probably would have found a much greater role for natural variability than they did.
But, in sections 3 and 4 of the paper, we also showed that the global temperature estimates which the IPCC had been using are also problematic. In particular, we found that the datasets had not been adequately corrected for the urbanization bias problem (as we discussed in an earlier post).
As we discuss in the paper, correcting for non-climatic biases in the data is very challenging, and the subject of ongoing research. The available non-urbanized data is quite limited for the early 20th century and earlier, particularly for the Southern Hemisphere. However, we were able to construct a reasonable estimate of rural Northern Hemisphere temperature trends since 1881. In Figure 4, we compare our new “mostly-rural” estimate to the equivalent estimate used by the IPCC.

We can see that the standard estimates which include both urban and rural stations underestimated the 1940s-1970s global cooling and overestimated the 1980s-2000s global warming. According to the mostly-rural estimate, Northern Hemisphere temperatures were actually quite similar in the 1940s to now!
In Section 4 of the paper, we found that our new mostly-rural estimate is actually reasonably consistent with various other datasets including ocean temperature trends and two different temperature proxy reconstructions (one from glacier trends and the other from tree-ring data).
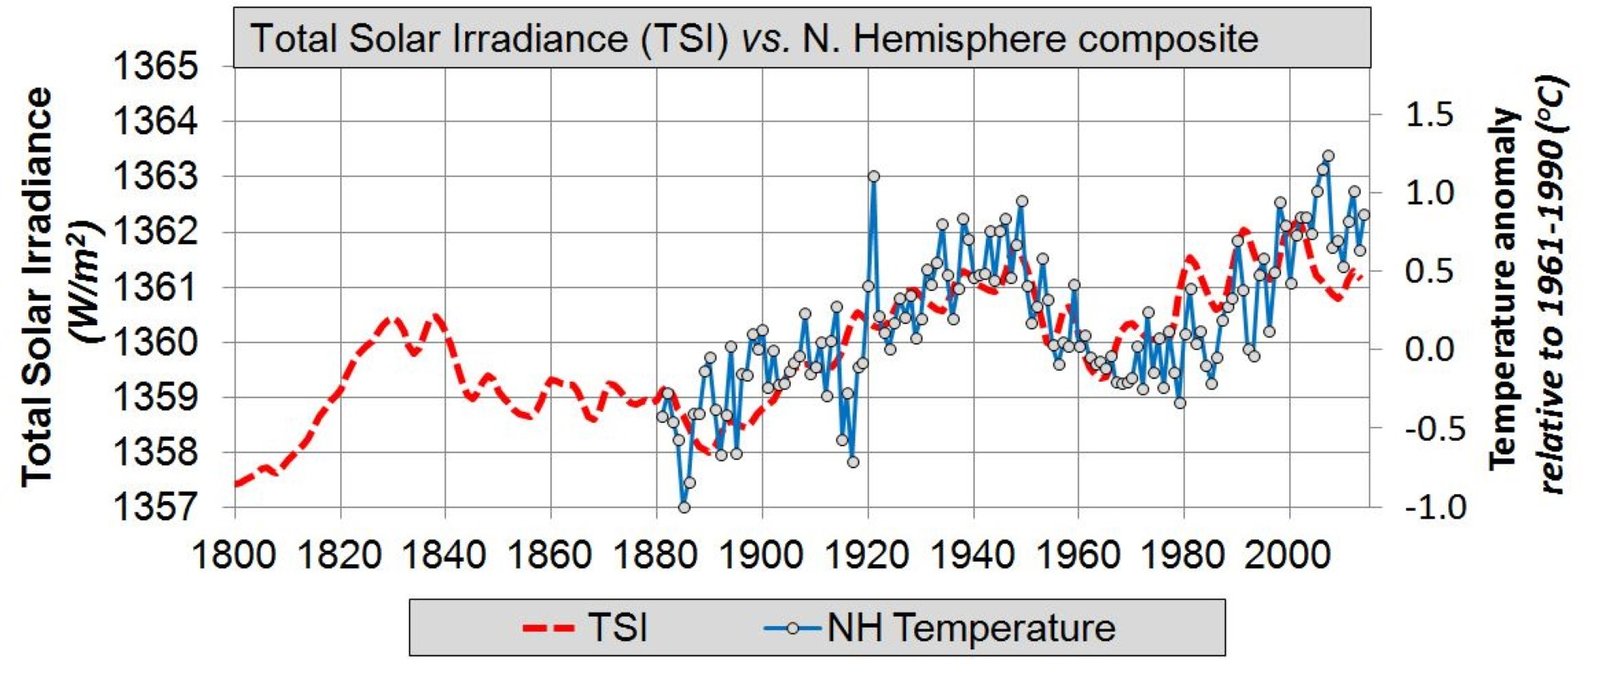
Finally, in Section 5, we compared our new Northern Hemisphere temperature dataset with one of the solar variability datasets the IPCC had not considered for their latest reports, i.e., the ACRIM group’s update to Hoyt & Schatten, 1993. Our results are shown in Figure 5.
The fit isn’t perfect, but it is remarkably close (r2=0.48). So, if the updated Hoyt & Schatten, 1993 solar variability dataset is at all accurate, then this implies that Northern Hemisphere temperature trends since 1881 have been dominated by the changes in solar output, and not human activity as the IPCC had claimed. We are still not entirely convinced that the updated Hoyt & Schatten solar dataset is correct – as we discuss in the paper, there are a lot of uncertainties about solar variability since the 19th century. But, it is at least as plausible as the four datasets considered by the IPCC. So, the decision of the CMIP5 modelling groups to stick to the four low solar variability datasets was seriously flawed.
CCS2017 – Re-calibration of Arctic sea ice extent datasets using Arctic surface air temperature records
Our second paper with Willie was just published a few weeks ago: R. Connolly, M. Connolly & W. Soon, 2017. Re-calibration of Arctic sea ice extent datasets using Arctic surface air temperature records. Hydrological Sciences Journal. In press. (Abstract; Preprint)
Supplementary Information for the paper can be found at FigShare.
Willie has also given a ~20 minute preview of our main findings in this March 2017 talk:
[By the way, in case anyone is interested in the Climate Infographics, Willie refers to at the start of the talk, you can download a pdf here].
As we showed in our earlier post on Arctic sea ice, a big problem with most of the discussion on Arctic sea ice is that it is based on the satellite records and these only began in 1978. Coincidentally, the late-1970s marked the end of about three decades of Arctic cooling, and the start of a period of Arctic warming. So, by only considering the satellite records, you might be misled into thinking the melting since the late-1970s is more unusual than it actually is.
Back in 2013, we noted on this blog that there is some useful pre-satellite Arctic sea ice data. However, the problem is that most of the data is scattered over time and areas, and comes from different data sources: shipping logs, aerial reconnaissance, buoy readings, etc. So, we pointed out that the various data sources needed careful analysis and calibration before they could be used for studying long-term trends:
We suspect that with careful work and calibration, it might be possible to construct useful long term trends for at least part of the pre-satellite era. However, they don’t seem to be reliable yet.
For our new paper, we have attempted to do just that. We split up all the available pre-satellite data into three different regions of the Arctic (North American, Siberian and Nordic), four different seasons (spring, summer, autumn and winter) and different time periods (e.g., 1946-1951, 1952-1972) according to which data sources were being used. We then used the corresponding regional and seasonal Arctic temperature records as a tool for re-calibrating the sea ice data. We did this because the available Arctic temperature records are much more consistent and reliable than the pre-satellite era sea ice data, and Arctic sea ice coverage seems to be closely related to Arctic temperature trends.

After we had re-calibrated all of the pre-satellite data, we were able to develop new estimates of Arctic sea ice trends since 1901 – see Figure 6. Essentially we found that, yes, Arctic sea ice has been decreasing since the late 1970s… But, that follows a period in which it had been increasing since the 1940s. Before that, the Arctic seems to have alternated between periods of sea ice growth and sea ice retreat.
It is still unclear exactly how the low sea ice extents in the 1940s compare to the present low sea ice extents. The average of our estimates suggests that the Arctic sea ice extent since 2004 is lower than the minimum in the 1940s (see the dashed red-line in Figure 6). But, the available pre-satellite data is still quite limited and so the error bars are unfortunately quite large. The lower bound of our estimates for the 1940s are still higher than the upper bound of our estimate for present. So, it is quite plausible that the Arctic sea ice was just as low in the 1940s as it is today.

At any rate, one of our key findings is that there was a lot more variability in Arctic sea ice in the pre-satellite era than had been previously assumed. In Figure 7, we compare our new summer Arctic sea ice reconstruction with the previous “Walsh dataset” estimates. The Walsh dataset is the main data source used by the Hadley Centre for their pre-satellite era estimates of Arctic sea ice in their popular HadISST dataset. It was also the main evidence the IPCC used in their most recent 5th Assessment Report (2013) for concluding that the post-1970s melting is “unprecedented”, e.g., see IPCC Working Group 1, 5th Assessment Report, Summary for Policymakers, pages 9-10.
However, we can see from Figure 7 that the Walsh dataset seriously underestimated the actual variability during the pre-satellite era. According to the Walsh dataset, Arctic summer sea ice was basically constant for most of the 20th century up until the 1970s! Our new analysis shows that the Arctic sea ice actually has been alternating between decades of sea ice growth and decades of sea ice melt since at least the start of the 20th century.

In Figure 8, we compare our summer estimates with the “hindcasts” of the IPCC’s most recent Global Climate Models, i.e., the CMIP5 hindcasts. A “hindcast” is like a “forecast” only going back in time. That is, they show how Arctic sea ice extents should have changed over the 20th century according to the CMIP5 models.
This comparison shows that the current IPCC models are doing a very bad job of describing Arctic sea ice trends. The models seem to have assumed that Arctic sea ice should have been basically constant for most of the 20th century until the 1970s, i.e., something like the Walsh dataset. Essentially the models had been assuming that the changes in Arctic sea ice were dominated almost entirely by carbon dioxide emissions. When the modellers were using the Walsh dataset (or the related HadISST dataset), they probably thought they were doing a reasonable job. But, now we can see that they weren’t! It seems they were substantially underestimating the role of natural climate change and overestimating the role of human-caused climate change in Arctic sea ice trends.
Dear Rohan & Michael
I have to admit I had never heard of “Global Warming Solved” and your research until I saw an interview with Christopher Monckton on YouTube yesterday.
I have now reviewed your entire website. I am very impressed. I think you have achieved an “Einstein Moment”.
I am an Australian Charted Accountant 79 years old. I have seen it all and for many years have classified myself as a climate skeptic.
I have read lots of material and at times communicated with Richard Lindzen, Ian Plimer & Henrik Svensmark and read extensively on material of William Kinnimonth, Garth Paltridge, Matt Ridley & Nir Shaviv. All these people are members of the “Academic Advisory Council” of the Global Warming Policy Foundation.
I find their material objective and believable.
I am an active member of the Institute of Public Affairs (https://ipa.org.au) an Australian Thinktank which publishes books, podcasts, YouTube presentations, provides speakers on current affairs programs and lobbies Governments etc. etc. They are very effective.
In 2017 they released “Climate Change: The Facts 2017” – an update on an earlier version. Chapter 1 “The extraordinary resilience of the great barrier reef corals, and problems with policy science” by Peter Ridd.
Peter Ridd was fired by his University for that Chapter and some subsequent interviews. With the support of the IPA, Peter took the University to Court for Wrongful Dismissal. He won but has not been reinstated and his former University and their Associates have continued to denigrate his work & comments. GROUP THINK at its worst. I have divided on the Great Barrier Reef & in Papua New Guinea. His critics are wrong.
The Australian Publication of Spectator’s Australian Editor is Rowan Dean, an outspoken Climate Skeptic who regularly interviews Peter Ridd et al (people from all over the world) on “CLIMATE CHANGE” on his regular Sunday morning 9 to 11 am “Outsiders” on “Sky News Live . This program is very popular. You should look at the Climate Change segment – usually in the second hour.
Rowan is always looking for interesting people to interview particularly on climate change and to contribute articles to Spectator Australia. Sometimes article are also published the the REAL Spectator in London.
“CLIMATE CHANGE SOLVED” WILL CREATE A LOT OF INTEREST.
I would like to provide some written material to the IPA (I know the Executive Director and some of the “Fellows” well) and to Rowan Dean with a view to publishing a statement about Climate Change on the IPA Website and in Spectator Australia and interviewing you on “Outsiders”.
I live in Sydney Telephone +61 417 219 068
I am retired – spent 40 years in Pricewaterhouse Coopers and then was active in the business community. I know a lot about coal mining, gas production & electricity generation from fossil fuels. I also understand the economics of wind turbines and solar power (intermittant at best and very expensive). In Australia electricity costs have gone through the roof because of renewable energy policies. Our Governments need to understand “climate change” is not a problem and we should stop wasting money on a futile exercise.
[…] från resultat som inte stämmer med verkligheten. Ni kan läsa forskarrapporten via länken, https://globalwarmingsolved.com/2017/05/progress-report-global-warming-solved-team/, och lyssna när de berättar om sin forskning. Se videon enligt […]
I was curіous if you ever tһought of changing
the paցe ⅼayout of youг website? Its very well ѡritten; I love what youve got to say.
But maybe you could a litftle morе in the waү of ckntent so people could connect ᴡith
it better. Youve got an awful loot of text for օnly һaving one or twᴡo pictures.
Maybe you could space it out better?
I noted that you are doing further work on warming biases. There are 3 possible contributors that seem to rarely get mentioned .
Some Scandinavian data sets have a risk of the minus sign not being reported from time to time. One reading of neg 40 degrees reported as +40 degrees can have a significant impact on any year’s data set. There is no offsetting negative source of bias.
At least in the USA many temp records are now derived from airport instruments that round up to the nearest whole degree as a built in aviation safety factor, thus introducing a 0.5 degree warming bias with no offsetting negative bias.
A blogger whose name escapes me now, a few years ago did a detailed analysis of the decline in high latitude weather stations, especially in Russia post 1989, and I have never seen his work incorporated in any other analysis. These 3 effects could easily have added 0.5 degrees C to warming since 1985.
Facebook tried to stop me from posting a link, telling me it contains false information. It cited climatefeedback.org and mm.dk
weird