Summary
In this essay, we will briefly summarise the analysis in our Global temperature changes of the last millennium paper, which we have submitted for peer review at the Open Peer Review Journal.
In this paper, we reviewed the so-called “multi-proxy” studies which attempt to estimate how global temperatures have varied over the last 1000 years. Such studies cannot use thermometer records, as thermometers did not exist 1000 years ago. Instead, the studies rely on the use of temperature “proxies”, such as tree rings and lake sediments.
All of the studies we analysed reported at least three distinct climatic periods over the last millennium – two warm periods (the “Medieval Warm Period” and the “Current Warm Period”) and an intervening cool period (the “Little Ice Age”). However, there was a lot of disagreement between the different studies as to how these periods related to each other.
Some of the studies suggested that the Current Warm Period is dramatically warmer than the earlier warm period, which has led many people to believe that recent global warming is man-made (and due to CO2). However, other studies suggest that the Current Warm Period and the Medieval Warm Period were both comparable. Since the Medieval Warm Period predates the Industrial Revolution, it could not have been due to man-made global warming, and so presumably was a natural phenomenon.
If natural global warming caused a warm Medieval Warm Period, then perhaps much (or all) of the recent global warming was also a natural phenomenon, i.e., not man-made global warming! Alternatively we could say that the warmer the Medieval Warm Period was, the less “unusual” the Current Warm Period is. For this reason, the debate over the Medieval Warm Period has become intrinsically linked with the man-made global warming debate.
Unfortunately, we found a large number of very serious flaws in almost all of the studies. Some of these flaws could be easily overcome, if they were recognised by the scientific community. Others are more challenging, and would probably require a lot of careful and considered discussion, if they are to ever be resolved. As a result, the multiproxy studies might not be as reliable as currently thought. If this is the case, then, despite all the suggestions of pre-19th century cool and warm periods, we still can’t reliably compare temperatures before the thermometer era to current temperatures.
Introduction

In several of our papers on global temperature trends, we used datasets of weather station records to look at how global temperatures have changed since the late-19th century. However, what were temperatures like before the late-19th century? Unfortunately, there were not many weather stations then. And indeed, thermometers were only invented in the 16th and 17th centuries, while the Fahrenheit and Celsius scales were only proposed in the 18th century. So, thermometer records cannot directly tell us about temperatures before then.
To overcome this problem, a lot of researchers have tried to find different “temperature proxies” which could provide longer estimates. A temperature proxy is anything whose properties might have changed over the centuries whenever it got colder or warmer. For instance, a tree might grow faster during warm summers than during cold summers. So, the thickness of the tree rings in each year could be used as a proxy for local summer temperatures. Various proxies have been proposed over the years, such as lake sediments and ice cores, as well as tree ring widths.
Although these proxies are not actually temperature measurements, “paleoclimatologists” (scientists who study the climate of the past) hope that by comparing their proxy record to a local thermometer record, they can “calibrate” their proxy in the period where they both overlap. They then hope they can use their calibrated proxy record to approximate the local temperature changes over a much longer period than they could with the short thermometer record.
For example, in the video clip below, Peter Brown from Rocky Mountain Tree Ring Research describes how tree ring widths can be used to study climate:
In recent decades, a number of groups have tried combining sets of these proxy records together to construct long-term estimates of global temperature change over the last millennium or so. Because these studies combine multiple proxies from around the world, they are often referred to as “multi-proxy global temperature estimates”.
In our “Global temperature changes of the last millennium” paper, we reviewed these estimates, discussed the assumptions and approximations they made, and attempted to assess what they tell us about the global temperature trends of the last millennium. In this essay, we will summarise our main findings. But, if you are interested in learning more about temperature proxy studies, we provide a much more detailed review and discussion in the paper itself.
The “hockey stick graph”
One of the most prominent of the multi-proxy temperature estimates was a two-part study by three researchers: Mann, Bradley & Hughes. Their two papers were Mann et al., 1998 (Abstract; Google Scholar access) and Mann et al., 1999 (Abstract; Google Scholar access).

These two papers (often called “MBH98” and “MBH99” respectively, after the authors’ initials and the year of publication) suggested a dramatic conclusion. Their study claimed that from 1000-1900 AD, the world (or at least the Northern Hemisphere) had been gradually cooling. But, suddenly, at the start of the 20th century, a period of rapid global warming began. The graph from the studies became known as the “hockey stick graph”, because it looked a bit like an ice hockey stick, lying on its flat (see the Figure on the right/above).
The Mann et al. studies seemed to vindicate those who had been claiming that the recent global warming was unusual and “man-made”. As a result, it received a lot of publicity, and featured heavily in the IPCC’s 3rd Assessment Report (2001) and Al Gore’s popular “An Inconvenient Truth” film (although it was mistakenly labelled as “Dr. Thompson’s Thermometer”).
Still, despite its initial popularity, subsequent analysis revealed a number of serious flaws in the studies (see our paper for a review). So, its dramatic conclusion is probably unreliable. However, its lead author, Prof. Michael Mann, has strenuously objected to any criticism of his papers, even co-founding a popular climate blog, Realclimate.org, and writing a book, to counter criticism. He believes that his critics are part of a global conspiracy to suppress his findings:
Other millennial temperature studies
Nonetheless, there have actually been quite a few other proxy-based global temperature estimates covering the 1000 years. Including the Mann et al. studies, we found 17 studies (20 estimates):
- Jones et al., 1998 (Abstract; Google Scholar access)
- Mann et al., 1999 (Abstract; Google Scholar access)
- Briffa, 2000 (Abstract; Google Scholar access)
- Crowley, 2000 (Abstract; Google Scholar access)
- Esper et al., 2002 (Abstract; Google Scholar access)
- Mann & Jones, 2003 (Abstract; Google Scholar access)
- Moberg et al., 2005 (Abstract; Google Scholar access)
- D’Arrigo et al., 2006 – “RCS” (Abstract; Google Scholar access)
- Hegerl et al., 2007 – “long” (Open access)
- Juckes et al., 2007 – “union” (Open access)
- Loehle, 2007 (Abstract; pdf available here)
- Mann et al., 2008 – they did two estimates: “CPS” and “EIV” (Open access)
- Ljungqvist, 2010 (Abstract; Google Scholar access)
- McShane & Wyner, 2011 (Abstract; Google Scholar access)
- Christiansen & Ljungqvist, 2011 (Open access)
- Christiansen & Ljungqvist, 2012 (Open access)
- Shi et al., 2013 – they did three estimates: “PC10+AR2”, “CPS” and “EIV” (Abstract; Google Scholar access)
In our paper, in order to directly compare the different estimates, we rescaled them all so that they had the same mean and standard deviation over their common period with each other and one of the Climate Research Unit’s thermometer-based global temperature estimates, “CRUTEM3”, i.e., 1850-1935.
Also, for visual clarity, in this essay, we will only plot the 31-year running means of these estimates. See our paper for a discussion of the pros/cons of this approach.
All 20 of these proxy-based estimates have important similarities. They all have identified at least three climatically distinct periods: two relatively warm periods – the “Current Warm Period” (c. 1900 AD on) and the “Medieval Warm Period” (c. 800-1200 AD), and a relatively cool period – the “Little Ice Age” (c. 1500-1850 AD). The main disagreement is over how these three periods compare to each other.

A few studies suggest that the Current Warm Period is much warmer than the Medieval Warm Period, i.e., the “hockey stick” studies.
These studies have been very popular amongst those claiming that the recent global warming is due to man-made global warming, and therefore very unusual.
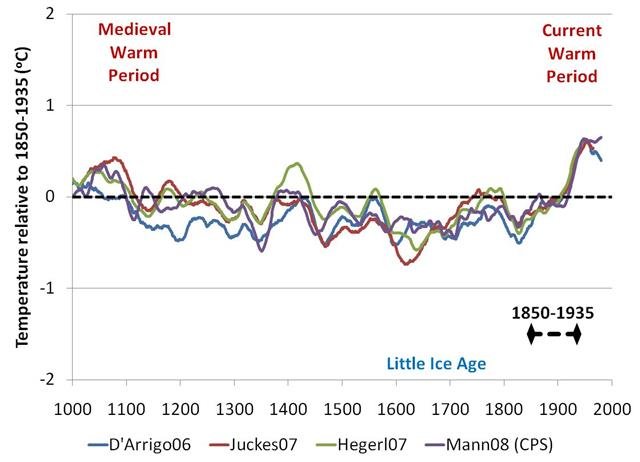
Other studies agree that the Current Warm Period is a bit warmer, but suggest that the Medieval Warm Period was also quite warm.
These studies don’t rule out the possibility that the recent warming is unusual or that some of it is man-made. But, they do suggest that there is a lot of natural temperature variability over timescales of centuries. They don’t imply that recent temperatures are unusually warm, just that the recent warm period is warmer than the last similar warm period.

Finally, several studies suggest that the Medieval Warm Period was just as warm as (if not warmer than) the Current Warm Period.
Again, these studies don’t rule out the possibility that man-made global warming could have been occurring recently. But, they do suggest that temperatures naturally vary quite substantially from century to century. So, if man-made global warming were occurring, it should not be confused with the natural global warming since the Little Ice Age.
In summary, all of the studies seem to agree that there has been considerable global warming since at least the 19th century. Instead, the main disagreement seems to be over how “unusual” the recent global warming was. This disagreement ties into the debate over man-made global warming, because if the Current Warm Period is not that unusual, then man-made global warming could be either (1) superimposed over considerable “natural global warming” or (2) non-existent (in which case global warming would have nothing to do with our “carbon footprint”).
Still, if that was all that was left to be resolved, then we could actually be quite satisfied with the progress that has been made. Sure, there is still bitter disagreement over the the magnitudes of the warming and cooling periods, but at least everyone agrees on whether different periods were warming or cooling.
Unfortunately, things are not even that simple…
The first problem is that the proxy-based global temperature estimates do not actually agree with the thermometer-based estimates very well.
The thermometer-based estimates only cover a century or so, so if the proxy-based estimates do not even agree with the weather stations during the short period in which both records overlap, how confident can we be in the proxy records for longer periods, such as the last millennium?
We found two substantial disagreements between the proxy-based and the thermometer-based estimates.
The divergence problem
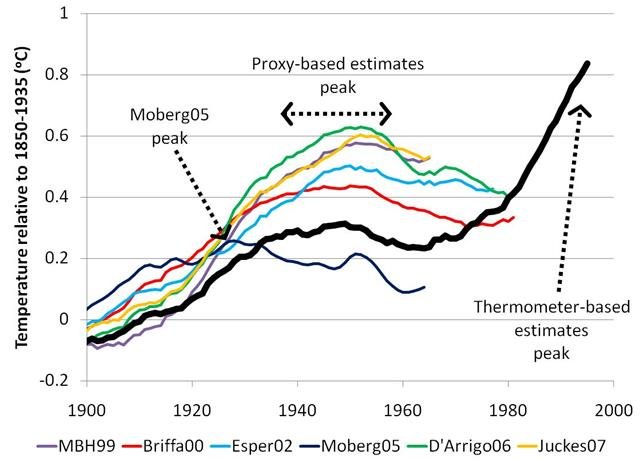
One noticeable disagreement is that most proxy-based estimates suggest the warmest temperatures in the 20th century were in the early-to-mid-20th century. In contrast, thermometer-based estimates (e.g., the Climate Research Unit’s “CRUTEM3”) suggest that there has been almost continuous global warming since the late-19th century. This can be seen in the figure on the right/above, where the thick black line shows the thermometer-based estimates and the other lines show various proxy-based estimates.
Perhaps part of the problem is that more than half of the proxy-based estimates finish before 1980. But, regardless, all except two (Mann & Jones, 2003 and Mann et al., 2008 “CPS” – see Supplementary Information for our paper here) reach a warm peak by the 1940s-50s at the latest. They then show cooling until they finish.
This disagreement between proxies and thermometers has become known as the “divergence problem”. It was originally thought to be limited to tree-ring proxies from high latitude regions in the Northern Hemisphere. But, we found that it occurs for most of the proxy-based global temperature estimates.
In any case, the problem has important implications for man-made global warming theory:
- If the problem lies with the proxies, then how do we know they wouldn’t have had similar problems in other centuries? For instance, if they are underestimating current temperatures, then maybe they also underestimated temperatures in the Medieval Warm Period.
- If the problem lies with the thermometer records, then this suggests that the thermometer records have exaggerated recent temperature trends. It also would suggest that it was warmer in the earlier 20th century than it is now, even though CO2 concentrations are much higher now.
In three of our papers we find that the thermometer records are seriously affected by urbanization bias (see here for a summary), and in a fourth paper we find that they are also biased by changes in the local surroundings of the weather stations (see here for a summary). So, the second possibility is at least partially correct. But, perhaps there are also problems with the proxies.
By the way, the divergence problem received some discussion during the “Climategate” controversy, when it transpired that some prominent climate researchers had deliberately hidden the end part of the proxy estimates in some of their presentations, so that the divergence problem wouldn’t be seen. This was very unscientific as Prof. Richard Muller explains in the following extract from a presentation in September 2010:
The convergence problem
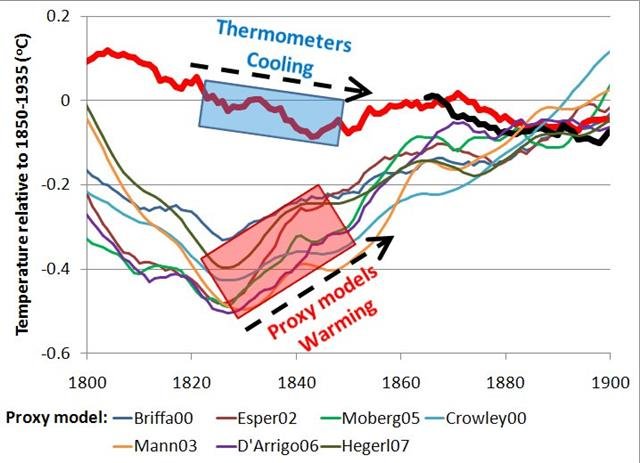
In the 19th century, the proxy-based estimates seem to have the opposite problem. Unfortunately, there are very few thermometer records which stretch back far into the 19th century and most of them are from around the same area (i.e., Europe). Nonetheless, of those records which do exist, many suggest a cooling trend during the 19th century. In contrast, many of the proxy-based estimates suggest a warming trend for the 19th century (i.e., warming from the “Little Ice Age”). As you can see from the figure on the right/above, it is only towards the end of the 19th century that both types of estimates converge.
So, while there is a divergence problem for the 20th century, there is also a “convergence problem” for the 19th century.
Why is there such disagreement between the thermometer and proxy estimates? Well, supporters of the claim that recent temperatures are “unusual” and at least partly due to “man-made global warming” have suggested that:
- The divergence problem is due to problems with the proxies, e.g., D’Arrigo et al., 2008 (Abstract; Google Scholar access), while,
- The convergence problem is due to problems with the thermometers, e.g., Böhm et al., 2010 (Abstract; Google Scholar access).
But, perhaps the opposite holds? Or maybe there are problems with the thermometers and the proxies during both periods?
As we mentioned earlier, in several of our papers we have identified a number of serious biases in the thermometer-based estimates. So, our work would suggest that much of the divergence problem could be explained by problems with the thermometers. Perhaps, the same also applies to the convergence problem.
However, there are also a number of serious problems with the proxies. So, maybe there are problems with both sets of estimates. In our paper, we discuss several of the potential proxy problems. For brevity, we’ll just discuss two here…
The “convergence problem” is less pronounced in some of the estimates we haven’t shown here, e.g., Mann et al., 1999 or Loehle, 2007 (see the Supplementary Information of our paper for the complete set – Provide link!). But, it should be noted that some estimates, e.g., Mann et al., 1999, actually use long European thermometer records as “temperature proxies”! So, this may explain some of the reduction in the problem.
Inconsistency between proxies
One serious problem is that different proxy records suggest quite different temperature trends – even for the same area. Indeed, even proxy records from the same data can be different, depending on how the data is processed.

For instance, the two proxy records in the figure on the left/above are different versions of the same “Polar Urals” tree ring data in Siberia.
In the Esper et al., 2002 version, the Medieval Warm Period seems to have been warmer than the Current Warm Period. Indeed, it also appears to have been warmer in the 14th and 15th centuries. But, the Briffa et al., 1995 version suggests the exact opposite.
This leads to a very difficult problem. If a researcher chooses to use the Esper version then it will make the Medieval Warm Period seem warmer than the Current Warm Period. But, if they choose to use the Briffa version, it will make the Medieval Warm Period seem colder than the Current Warm Period!
Both of the versions have their own problems, so some researchers might prefer one over the other. But, it is surprisingly unclear which of the versions best represents local temperature trends in the Polar Urals region. Indeed, it is quite likely that neither of them are accurate temperature estimates!
In our paper, we discuss several other examples where different proxies suggest different temperature trends for the same area. By choosing one proxy record instead of another one, a researcher can radically alter their temperature estimates. This means that proxy selection is a very subjective process.
This lack of consistency between individual temperature proxies, even in the same area, raises serious questions about the reliability of the global estimates.
Overlap in proxies used
Because there are only a small number of proxy series whose records cover the last millennium, some proxy series end up being re-used in different proxy-based estimates.
Two sets of proxies have been particularly controversial – the Yamal chronology and tree ring proxies constructed from bristlecone/foxtail pines in western U.S.
Both sets have particularly unusual “hockey stick”-like trends. And, in both cases, there are a number of reasons to doubt that their trends genuinely represent temperature trends (see our paper for a review).
But, between them, they are used by 14 of the 17 studies!
In some studies, the unusual trends of these series may not overly influence the overall estimates, e.g., Moberg et al., 2005 “detrended” their tree-ring series before using them. But, the fact that they are used so frequently unnecessarily raises doubts about the reliability of the estimates.
Table. The use of the Yamal chronology or bristlecone/foxtail pine proxies by the different estimates:
| Study | # proxies | Bristlecone/foxtail pines | Yamal chronology |
|---|---|---|---|
| Jones et al., 1998 | 17 | ||
| Mann et al., 1999 | 12 | Yes | |
| Briffa, 2000 | 15 | Yes | |
| Crowley, 2000 | 15 | Yes | |
| Esper et al., 2002 | 14 | Yes | |
| Mann & Jones, 2003 | 13 | Yes | Yes |
| Moberg et al., 2005 | 18 | Yes | Yes |
| D’Arrigo et al., 2006 | 19 | Yes | |
| Hegerl et al., 2007 | 14 | Yes | Yes |
| Juckes et al., 2007 | 13 | Yes | |
| Loehle, 2007 | 18 | ||
| Mann et al., 2008 | 1209 | Yes | |
| Ljungqvist, 2010 | 30 | ||
| McShane & Wyner, 2011 | 1209 | Yes | |
| Christiansen & Ljungqvist, 2011 | 40 | Yes | Yes |
| Christiansen & Ljungqvist, 2012 | 32 | Yes | Yes |
| Shi et al., 2013 | 45 | Yes | Yes |
Conclusions
If the current proxy-based estimates are in any way reliable, then it suggests that global temperatures vary significantly from century to century. They also suggest that the 20th century was warmer than the centuries immediately before it (the “Little Ice Age”). However, there is still disagreement over whether a warm period around 1000 years ago (the “Medieval Warm Period”) was similar, warmer or cooler than the “Current Warm Period”.
In our papers studying weather station records, we found that global temperatures have alternated between relatively cool and relatively warm periods roughly every 30/40 years since at least the late 19th century. If the proxy-based estimates are correct, then this semi-periodic behaviour probably needs to be superimposed onto longer term multi-centennial temperature changes.
However, there are a number of reasons to question the reliability of the proxy-based estimates. If they are unreliable, then the large temperature variability from century to century they imply might be wrong.
It would seem that multiple analysis of most published thermometer records for the twentieth century have been deliberately “adjusted” to suit the current mantra rather than actual data. Would it not be better to examine records from before such “adjustments” instead of accepting The Climate Research Unit’s “CRUTEM3” at face value? This is of legitimate concern because if the graph you use has been adjusted to skew modern temperatures then no wonder modern proxies diverge!