Summary
In this post, we summarise the main findings of our 2019 peer-reviewed paper, “Northern hemisphere snow-cover trends (1967-2018): A comparison between climate models and observations” that was published in the scientific journal, Geosciences. We show that the current climate models are completely unable to explain actual trends in snow cover for all four seasons.
Introduction
Since the 1970s, climate models have been consistently predicting that increasing greenhouse gases should be causing substantial “human-caused global warming” (sometimes called “anthropogenic global warming”).
These models slightly disagree with each other over exactly what “climate changes” this would cause. However, one thing that all the models have agreed on is that the total snow cover should have been continuously and steadily decreasing every year since at least the 1970s. The models also say that this decrease in snow cover should be accelerating over the years as greenhouse gas concentrations continue to increase.
Coincidentally, the longest running satellite-based record of any climate parameter is the weekly snow cover of the Northern Hemisphere. This dataset compiled by the Rutgers University Global Snow Lab in collaboration with NOAA covers the period from late-1966 to present. The “Rutgers dataset” can be downloaded here.
Meanwhile, snow cover is also one of the climate parameters modelled by all of the “CMIP5” global climate models (GCMs) used for the UN Intergovernmental Panel on Climate Change (IPCC)’s most recent Assessment Report (2014’s AR5). Although the climate modelling groups mostly focus on “projections” of how the climate will change in the future, they are also encouraged to run so-called “hindcasts”.
A hindcast is the opposite of a forecast. The computer model reverses the clock in its model world back to e.g., 1850 AD, and then simulates the climate changes that the model expects should have occurred from then up to present. By comparing these hindcasts to observed historical climate trends, this gives us an idea of how reliable the computer models are.
Therefore, in a recent paper we published in 2019 in the scientific peer-reviewed journal, Geosciences, we decided to compare the computer model hindcasted Northern Hemisphere snow cover trends to the observed satellite record over the entire available period, i.e., 1966-2019. This gave us more than half a century of a comparison of the models with reality. We downloaded the model hindcasts from KNMI’s “Climate Explorer” website.
If you’re interested in full details of what we found, we recommend reading the paper itself. It’s open access and can be downloaded at https://doi.org/10.3390/geosciences9030135, or you can download a pdf here. But, here we will briefly summarise our key findings.
What does the UN IPCC say about snow cover trends?
Many scientists rely on the UN IPCC’s Assessment Reports (AR) when they are researching climate change. So, it is worth looking at what the most recent IPCC AR5 said in their influential summary for policymakers section about snow cover:
“There is very high confidence that the extent of Northern Hemisphere snow cover has decreased since the mid-20th century. Northern Hemisphere snow cover extent decreased 1.6 [0.8 to 2.4] % per decade for March and April, and 11.7 [8.8 to 14.6] % per decade for June, over the 1967 to 2012 period.” – IPCC Working Group 1’s 5th Assessment Report, Summary for Policymakers, p7-8.
We can confirm that each of the above sentences is technically accurate. The linear trends over the 1967-2012 period for March, April and June are indeed negative (as we will see later). And, when listed one after each other, it makes it sound like snow cover is melting across the board dramatically and continuously. So, if you didn’t dig further into the data yourself, you could be forgiven for thinking the climate models are right… and that this melting is unusual and due to human-caused global warming. Indeed, early in their summary for policymakers, the IPCC single out decreasing snow cover as one of their main arguments for why recent climate change is allegedly very unusual:
“Warming of the climate system is unequivocal, and since the 1950s, many of the observed changes are unprecedented over decades to millennia. The atmosphere and ocean have warmed, the amounts of snow and ice have diminished, sea level has risen, and the concentrations of greenhouse gases have increased” –IPCC Working Group 1’s 5th Assessment Report, Summary for Policymakers, p2. [emphasis added in bold]
However, as we will see below, the authors of the IPCC’s summary for policymakers section were remarkably selective in how they described snow cover trends. They essentially only reported the very specific results that were consistent with their overall conclusions. Meanwhile, they neglected to mention that most of the results for snow cover are very inconsistent with their conclusions.
Breakdown of the trends for each season
The Rutgers dataset and computer model hindcasts give monthly data. However, rather than looking at each month separately, for simplicity, in our study, we focused on the seasonal averages, i.e., spring (March, April, May); summer (June, July, August); autumn/fall (September, October and November) and winter (December, January, February).
If you look carefully at the quotes from the IPCC above, they only singled out three months as being noteworthy, i.e., two spring months (March and April) and one summer month (June). However, the monthly averages are broadly similar to the seasonal averages for spring and summer.
So, let’s look at these two seasons first. In each of the figures below, we have plotted the observed trends from the satellite records in the top panels. In the bottom panels, we show the average of all 196 of the IPCC’s “CMIP5” climate model hindcasts that provided snow cover results.
[Technical note: For simplicity, we are reporting here the “ensemble averages” for the climate models. However, in the paper, we also report and discuss the variability within individual model runs to account for what is called “internal variability” in the modelling community. The results are broadly similar.]
There are several things to note:
- For both spring and summer, technically, the long-term “linear trend” is indeed of a general decrease since the late 1960s. However, there is a lot of variability from year-to-year, and so looking at the data in terms of “linear trends” is misleading.
- We can see that most of this decrease actually occurred in the mid-1980s, and possibly a second decrease for summer snow cover in the early-2000s. If anything there has been a slight increase in recent years.
- Meanwhile, the computer models all agree that there should have been a continual year-on-year decrease for both seasons since the 1960s.
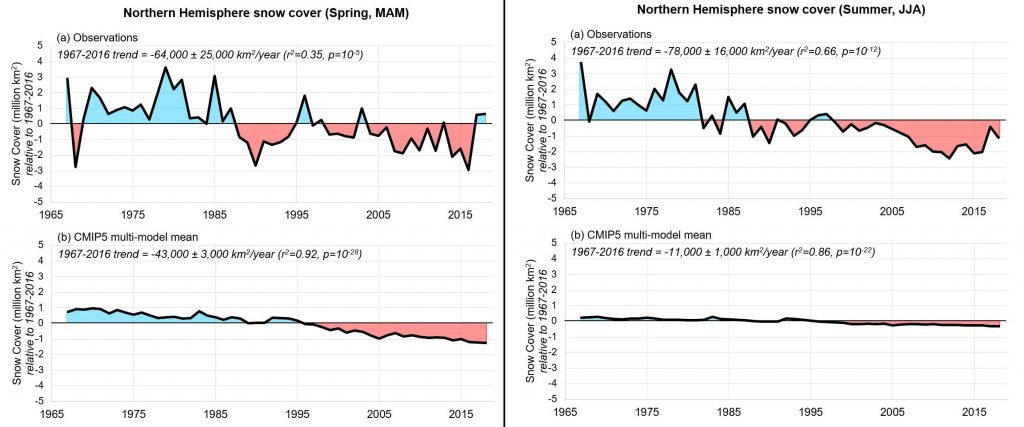
So, even though the computer models are technically getting the sign of the linear trend right for the spring and summer, they are still completely unable to explain the actual year-to-year trends at all. That is, all they can reproduce is the fact that spring and summer snow cover is less now than it was in the late 1960s.
However, the situation is even worse for the other two seasons. See below:
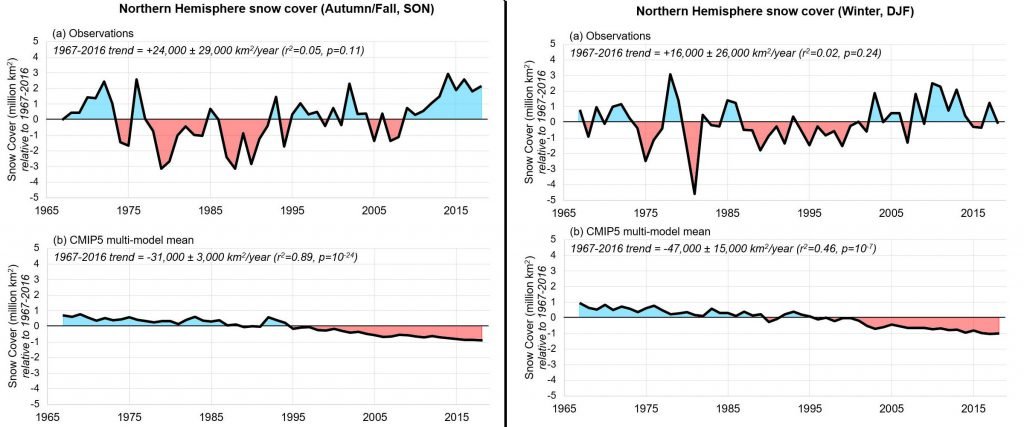
Again, there are several things to note:
- As before, the computer models all agree that there should have been a continual year-on-year decrease for both seasons since the 1960s.
- However, for both autumn/fall and winter, the actual observations have, if anything, shown a slight increase in snow cover.
- None of the current computer models can explain why snow cover might have increased in recent years.
Some researchers have proposed various explanations as to why the models might be failing to capture the increase in autumn/fall and winter snow cover, e.g., Cohen et al. (2012). However, at present, the computer models are unanimous in insisting that this should not be occurring. The models insist that due to increasing greenhouse gases, snow cover should have been steadily decreasing for all seasons since the 1960s.
Conclusions
For all four seasons, current climate computer models are unable to explain the observed trends in snow cover since satellites began monitoring it in 1967.
It is worth noting that these are the same computer models that the UN’s IPCC is using for concluding that most of the observed climate changes since at least the mid-20th century are human-caused. And that the IPCC has singled out “melting snow and ice” as one of the most significant aspects of climate change since the mid-20th century. So, the fact that the current computer models are getting the snow cover trends for all four seasons completely wrong should be of concern to those relying on the IPCC reports for their assessment of climate change.
Citation details for the full paper
Ronan Connolly, M. Connolly, W. Soon, D.R. Legates, R.G. Cionco and V. M. Velasco Herrera (2019). Northern hemisphere snow-cover trends (1967-2018): A comparison between climate models and observations. Geosciences, 9(3), 135. https://doi.org/10.3390/geosciences9030135 (pdf).