Summary
Since satellite records began, there seems to have been a general decline in average Arctic sea ice extent. Interestingly, this hasn’t occured for Antarctic sea ice.
The satellite records only began in October 1978, however. This coincided with the start of a recent warming trend in the Arctic. Before that, from the 1950s-1970s, Arctic temperatures were cooling. So, it is quite likely that in the decades immediately before the satellite records began, average Arctic sea ice extent was actually increasing, but we just weren’t monitoring it. It seems that the Arctic sea ice extent naturally goes through periods of expansion, followed by periods of contraction.
In case you’re unsure about which is which, the Arctic is the polar region in the north (the one with polar bears, etc.) and the Antarctic is the polar region in the south (the one with penguins, etc.)
In this essay, we look at what we know about Arctic sea ice extent.
The satellite era
Every winter, the sea ice in the polar regions grows, but then in the summer, it melts again.

Since winter and summer are reversed between the southern and northern hemispheres, this means that as the Arctic sea ice reaches its maximum extent in March, the Antarctic sea ice is reaching its minimum extent. By September, the situation has reversed (minimum Arctic and maximum Antarctic sea ice). This can be seen from the Google Earth images in Figure 1 (generated using data from NSIDC).
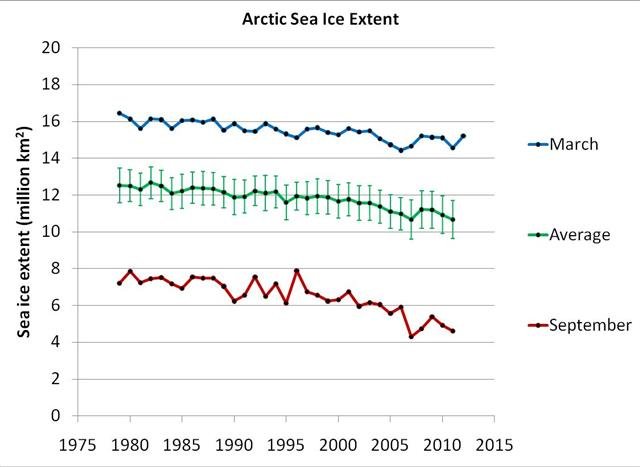
This cyclical pattern occurs every year. However, since satellite records began in 1979, the maximum (March) and minimum (September) sea ice extents in the Arctic seem to have been gradually decreasing. This can be seen from Figure 2 (generated using NSIDC data).
This has led many people to worry that it is man-made global warming which is causing the Arctic sea ice to melt, and that humans are therefore destroying an entire ecosystem, threatening animals such as polar bears.
As a result, much of the research in the Arctic in recent years has become dominated by a heavy focus on man-made global warming, rather than studying the Arctic as a fascinating region in itself. See for example, the Greenpeace video below:
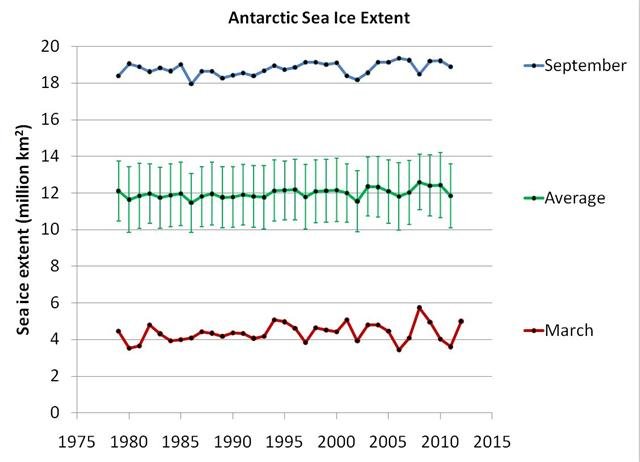
Interestingly, even though you might expect “global” warming to occur globally, in the southern half of the world, the Antarctic sea ice extent doesn’t seem to have changed much (see Figure 3). This apparent paradox has puzzled those who believe the Arctic melting is due to man-made global warming.
As a result, some groups have struggled to come up with explanations as to why man-made global warming is not causing melting of Antarctic sea ice. For example, Zhang, 2007 (Open access) proposed that warmer waters off Antarctica might make the water less salty, and that maybe this would stop the ice from melting. We believe a much simpler explanation is that the changes in the Arctic sea ice are not due to the “man-made global warming” assumed by current climate models. If the explanation is not “CO2-related”, then we would no longer need to worry about why the models don’t match the data – it would just mean that the models are wrong.
At any rate, since the Antarctic sea ice extent doesn’t seem to be declining, the public concern over sea ice seems to be confined to the Arctic. With that in mind, let us limit our discussion in this essay to the Arctic, i.e., the region which has shown a decrease in polar sea ice. The fact that the Arctic sea ice seems to have been steadily decreasing “since records began” does initially seem alarming. However, as we will see below, this is because “the records” only began in October 1978, as the satellites weren’t launched until then.
There may be some problems with the satellite estimates of sea ice extent, e.g., see here. Estimating sea ice extent from satellites is a complex problem – the satellites aren’t actually photographing the amount of ice, so it’s not a simple case of looking at a photograph and saying “oh, there’s some ice there, and none there”.
Instead, they measure microwave emissions. Analysts then try to convert those measurements into estimates of sea ice. These conversions rely on several different assumptions being valid. If there are problems with those assumptions, it may affect the reliability of the satellite estimates.
However, for the purposes of this post, we assume that the satellite estimates are reliable.
What do we know about Arctic temperatures?
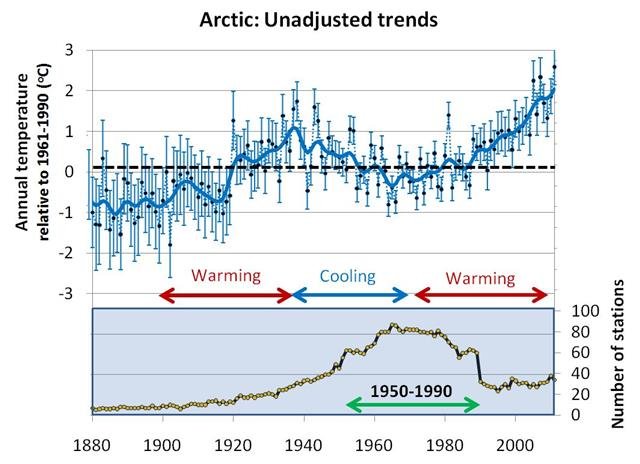
In Figure 4, the average annual temperature trends for the Arctic are shown (the graph is taken from our “Urbanization bias III” paper). We can see that there has indeed been a warming trend since the late 1970s. However, if we look at the rest of the data, the problem of the sea ice record only beginning in 1979 should become obvious – the warming trend since the 1970s followed a cooling trend from the 1940s. If the sea ice records had started just a bit earlier, they would probably have first shown sea ice growth!
Before the 1940s-1970s Arctic cooling, there also seems to have been another warming period (1900s-1930s). We do not have enough weather records to reliably tell what happened to Arctic temperatures before the 20th century, but it is at least plausible that similar cooling and warming periods also occurred then. It seems that temperatures in the Arctic naturally alternate between periods of warming and periods of cooling.
In the next sections, we will argue that sea ice conditions in the late 1970s were relatively severe. So, the fact that the Arctic sea ice extent seems to have been decreasing since then is not an indicator of “unusual and dramatic melting of the Arctic”. Instead, it seems that the satellite monitoring of the Arctic sea ice just coincidentally started at the wrong time, i.e., just when the last Arctic cooling period had ended!
But before we get to that, some readers might say, “If you look at the graph of Arctic temperatures since 1880, the linear trend shows warming, so that must be due to human activity!”. Well, no.
First, the trends are non-linear, so the “linear trend” is irrelevant. There are periods of both warming and cooling, so the linear trend changes depending on where you start and end your analysis. If you want to, you can technically calculate a “linear trend” for any (x,y) dataset, but if it is non-linear data, as is the case here, then it is a meaningless calculation. See our “Urbanization bias I” paper for more discussion.
Second, there is no reason to assume warming must be “man-made”, rather than just a natural occurrence. For instance, Prof. Syun-Ichi Akasofu, the founding director of the International Arctic Research Center (retired in 2007) argues that the world may still be recovering naturally from the Little Ice Age of the 18th and 19th centuries. Dr. Willie Soon has found that the warming and cooling trends in the Arctic are actually strongly correlated to changes in solar activity, e.g., Soon, 2009 (Abstract; Google Scholar access).
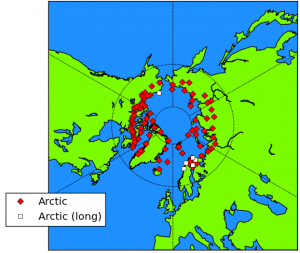
Finally, as we discuss in our “Urbanization bias III” paper, there are very few stations with long records available for the Arctic (see the bottom panel of the earlier figure showing Arctic temperature trends). The map in Figure 5 shows the locations of all the available stations – only six of the stations have data for 75 of the last 80 years, and five of them are from a relatively small region (northern Scandinavia).
This means that if there are non-climatic biases in any of the station records, it could strongly alter the apparent trends of the average “Arctic temperatures”. This is a particular concern for periods when the number of stations were very low, e.g., there appears to have been a sudden warming step change at about 1920, but there were only a few stations actually available then, so it is hard to know if the apparent step change was genuinely climatic.
For example, many of the Arctic stations are airport stations, and improvements in the airport infrastructure, such as insulation of permafrost-based runways (e.g., Instanes & Mjureke, 2005) could easily have introduced warming biases in recent decades.
Also, you might not think urbanization bias would be a major problem in the Arctic, since most of the big cities are at lower latitudes. But, in tundra conditions, even modest urbanization can introduce significant biases.
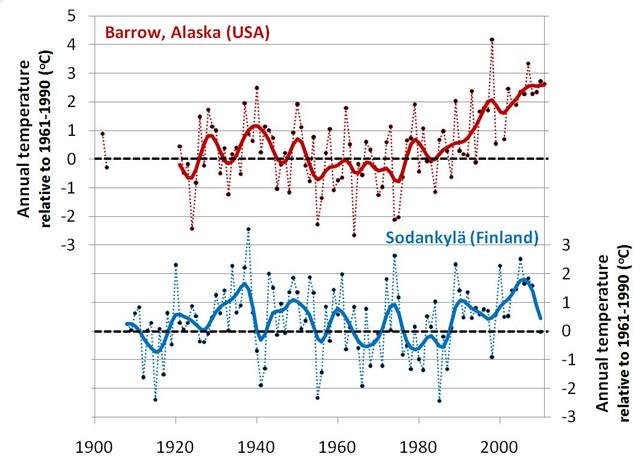
For instance, even though Barrow, Alaska (USA) still has a relatively small population (4,500 in 2000), urbanisation has led to a considerable urban heat island there in recent years – see Hinkel et al., 2003(Open access). This would have introduced an artificial warming trend which would make the recent warm period seem warmer than it actually was. In comparison, the rural Sodankylä, Finland station also shows a warming trend since the late 1970s, but it followed a cooling period from the 1940s, and its warmest year was actually in 1937 (see Figure 6).
So, unfortunately, the data is really too limited to make definite conclusions (e.g., only six stations with data for 75 of the last 80 years, and at least one of them is known to have an urban heat island). It may well be that the recent warm period was warmer than the early 20th century warm period, as the raw data suggests… Or it may be that biases in the raw data are substantial, and the early 20th century warm period was just as warm as the recent warm period, or maybe even warmer.
Whatever the case, it is clear that the Arctic seems to alternate between periods of warming and periods of cooling. Hence, the fact that “the Arctic sea ice has been decreasing since records began” is merely down to the fact that the records only began in 1978. In the next sections, we will try to estimate how sea ice varied, before the satellite era.
The pre-satellite era
A few groups have attempted to construct sea ice estimates for the pre-satellite era using various combinations of land, ship, submarine, buoy and aircraft measurements made over the years, e.g., the Chapman & Walsh dataset or the Zakharov dataset (Note that the server for the Zakharov dataset is not always online, so the link sometimes doesn’t work). These datasets represent a considerable amount of compilation work, and probably could be used to extract useful climate information. But, as we will discuss below, there are too many inconsistencies in the data sources for a simple analysis.
Some people have used these datasets to argue that the decreasing trend during the satellite era is an acceleration of an already decreasing trend in the pre-satellite era. For instance on the “Open Mind” blog, the blogger “Tamino” has used the Walsh & Chapman dataset to claim that the satellite era melt is unprecedented, e.g., here. However, these datasets should not be used for estimating long term trends. The problem is that such datasets are actually composite datasets constructed by compiling together as many measurements as the researchers can for a given year.
The measurement sources vary dramatically over the years. For instance, in Siberia, measurements up until the late 1930s were mostly from shipping lane reports, while after the late 1930s they mostly came from aircraft measurements. In addition, the actual regions with available data varied substantially over the decades. So, a sea ice estimate for a region constructed from shipping reports in the 1920s might not be directly comparable to an estimate for the same region from the 1940s made from aircraft measurements. Hence, they cannot be used for calculating long term trends.
We suspect that with careful work and calibration, it might be possible to construct useful long term trends for at least part of the pre-satellite era. However, they don’t seem to be reliable yet. For example, we saw in the previous section, that the temperature records show a period of substantial warming followed by a period of substantial cooling up to the satellite era. But, pre-satellite sea ice datasets such as Walsh & Chapman’s don’t show any of that variability in the pre-satellite era.
So, unfortunately, we can’t use the pre-satellite estimates for assessing how unusual the recent melting has (or hasn’t) been. Fortunately, there are ways of assessing how unusual the sea ice in 1979 (at the start of the satellite era) was. If the claim that the recent Arctic melting is unusual and due to man-made global warming were true, then this would mean that the sea ice extent in September 1979 was relatively low (September being the month of minimum sea ice in the Arctic).
In the following section, we will assess this claim, by trying to answer the question, “Would the great 19th and early 20th Arctic explorers have been able to carry out all their voyages if they had attempted it during 1979 conditions?” If September 1979 sea ice extent was already quite low, then 1979 conditions would have been relatively easy for them. However, as we will see, many of the early explorers managed to get much further than they could have in 1979. In other words, at the time of those voyages, the sea ice extent was probably much lower than it was at the start of the satellite era.
The great Arctic explorers
We have created a Google Earth file with approximate estimates of the various voyage paths described below. To construct the paths we downloaded estimated maps of the voyage paths, and manually clicked the approximate routes on Google Earth.
To generate the maps below, we first loaded Google Earth (if you haven’t already installed it, it is a brilliant program… and it’s free!).
Then we ran NSIDC’s September sea ice extent Google Earth file (downloaded from here), clicked play to let the video run through once (you need to do this to let Google Earth load the images), and then we scrolled the time bar back to 1979 (the date at the top says “1/1979”, but the NSIDC file only shows September values, so it actually means 9/1979).
Then we ran our Arctic voyages Google Earth file (that we had made earlier). When it’s first loaded, all voyages and placemakers are shown. But, you can deselect the ones you’re not interested in using the “Places” panel on the left hand side. Finally, we rotated our view and zoomed in as appropriate, and created a snapshot (File/Save/Save Image).
Voyages reviewed in this post
| Region | Route | Date of voyage | Description |
|---|---|---|---|
| Canadian Arctic | Northwest Passage | 1819-1820 | William Parry’s voyage to Melville Island |
| Canadian Arctic | Northwest Passage | 1845-46 | John Franklin’s last voyage |
| Canadian Arctic | Northwest Passage | 1903-1906 | Roald Amundsen’s Northwest Passage expedition |
| Canadian Arctic | Northwest Passage | 1940-1942; 1944 | St. Roch’s Northwest Passage expeditions |
| Russian Arctic | Northeast Passage | 1878-1879 | S/S Vega’s Eurasian circumnavigation |
| Russian Arctic | Northeast Passage | 1933-1934 | SS Chelyuskin’s voyage |
| Russian Arctic | Northeast Passage | 1893-1896 | Nansen’s Fram expedition |
| Russian Arctic | Northeast Passage | 1648 | Dezhnyov’s discovery of the Bering Strait |
Limitations of the following analysis
There are records of many Arctic voyages, some of which might not have been possible in 1979. The fact that these voyages occurred can be used as suggestive indicators of the ice extent in the area at the time. However, unfortunately, they are just that – suggestive indicators.
We believe that the examples below indicate that the Arctic sea ice extent in 1979 was quite high, and that there were many periods over the last few centuries when the sea ice extent was less. If this is correct, then the fact that the sea ice extent has been “declining since records began” (in 1979) doesn’t mean that recent trends are unusual. Instead it suggests that the Arctic sea ice extent shows considerable variability, and the records are just too short to notice.
But, there are a number of potential problems in relying on such records, e.g.,
- Records of early Arctic voyages are often mostly anecdotal and/or poorly mapped, e.g., see here or here. This is particularly the case for the pre-19th century voyages. So, it is plausible that the voyages didn’t extend as far as is claimed. Of course, it is also plausible that the voyages did do so.
- We don’t know for definite how far past the 1979 sea ice extent a particular crew would have been able to travel. Stubborn and persistent crews may have inched their way through thicker sea ice than we might expect.
- The fact that a crew made it through one region on a particular voyage, doesn’t tell us how long the ice was clear.
- Arctic sea ice is fairly dynamic, and sometimes when the ice in one area is expanding, in another area it might be decreasing. So, if a crew were able to travel ice-free in part of the Canadian Arctic on one day, it is possible that another area in the Siberian Arctic might have particularly heavy ice, for example.
- The NSIDC “sea ice extent” maps used in this section are not the same as their “sea ice concentration” maps. We will discuss this below.
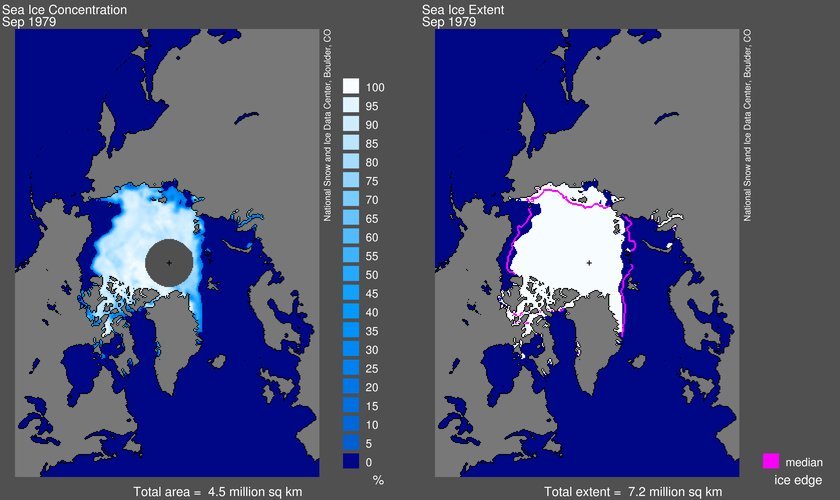
Maps taken from NSIDC define the “sea ice extent” which we use in this section as being the point at which “sea ice concentration” reaches 15%. So, regions within “the white area” were not necessarily completely filled with sea ice. The difference is illustrated in the maps in Figure 7.
When NSIDC are calculating the concentrations for a particular grid cell, they calculate both the area covered by ice and the length of time the ice was there. That is, a mean concentration of 50% for a particular grid cell in September could be the result of 100% concentration at that location for 15 days and 0% concentration for 15 days, 50% concentration for 30 days, or some other combination. For this reason, we can probably only definitively rule out the possibility of travel through regions with 100% sea ice concentration. So, it is plausible that a skilled and lucky crew could find an ice-free window in some such grids. But, travel anywhere within the 15% “extent” boundary would probably have been very challenging. See here for further discussion
So, the following analysis shouldn’t be relied on as conclusive evidence that the Arctic sea ice extent has been less than in 1979 many times in the past, but merely suggestive evidence.
The Northwest Passage (Canadian Arctic)
In the 19th century, there was a lot of interest from European countries, particularly Britain, in discovering a “Northwest Passage”. This would be some ice-free sea route which would allow ships to sail from Europe to Asia through the Arctic north of Canada. If such a route could be established, it could offer a quicker (and therefore cheaper) trade route between Europe and Asia.
In the modern world, where travel and trade can be done by plane, this might not seem a big deal. But, at the time, the only available routes were either to sail down to the southern tip of South America and northwest through the Pacific, or else sail to the southern tip of Africa and then northeast through the Indian Ocean. The Suez Canal (connecting the Mediterranean and Red Seas) was only opened in 1869 and the Panama Canal (offering a short cut through Central America) wasn’t completed until 1914.
Therefore, it is not surprising that several attempts to discover the Northwest Passage were well-funded and documented, and offered fame and fortune to any explorer who could succeed.
William Edward Parry’s 1819-20 voyage

One such expedition was that of the HMS Griper and HMS Hecla, led by William Edward Parry. They left England in May 1819, and by August had reached Lancaster Sound. A previous expedition, in 1818, led by John Ross had been blocked from further travel by ice. From the satellite data, it seems that it would have been similar in 1979 (see Figure 8). But, when Parry and his crew arrived, it was remarkably ice-free, and they were able to sail right on through Barrow Strait and onto Melville Island. In doing so the expedition earned a £5000 prize offered by parliament for any voyage that crossed a longitude of 110° West. After reaching Melville Island, they were stopped by ice. They returned to England in November 1820. See here, here and here. Parry’s own 1821 account of the voyage is available here.
John Franklin’s last voyage, 1845-46
A more tragic expedition was John Franklin’s final voyage, in 1845-46. By the 1840s, much of the Canadian Arctic coast had been visited and mapped on various British expeditions. Franklin had already led several such successful expeditions. So, in 1845, he was commissioned to explore some of the remaining unknown areas, and hopefully discover the elusive Northwest Passage. Sadly, he and his crew of 128 men became icebound near King William Island, and never returned.
The story of the expedition was the theme of a popular folk song, “Lord Franklin”, sung below by Allister Thompson:
One silver lining of the tragic expedition was that the search for Franklin and his crew in the following years was extensive, and as a result, within a few years, most of the area was mapped.

In cases such as Franklin’s last voyage, the exact route they took is unknown, since it was a failed voyage, and the crew didn’t make it back to describe their voyage. But, their final landing point near King William Island is known, as the wreck was eventually discovered there. So, there are only a few possible routes that they would have taken.
Most scholars believe they probably looped north around Cornwallis Island and then sailed south between Prince of Wales Island and Somerset Island until they reached King William Island (route marked with red line in Figure 9). Some other possible routes have been considered, e.g., Hickey et al., 1993 (Abstract; Google Scholar access) have suggested that after they reached Lancaster Sound, they headed west until they passed Prince of Wales Island, before heading south to King William Island. Hickey et al., 1993’s proposed alternative route is marked in light blue/cyan on the above map.
Still, whatever route they took, from the satellite estimates, it seems unlikely they would have gotten as far as they did, if they had attempted their voyage in 1979. See here and here for more on Franklin’s last voyage.
Roald Amundsen’s Northwest Passage Expedition, 1903-1906
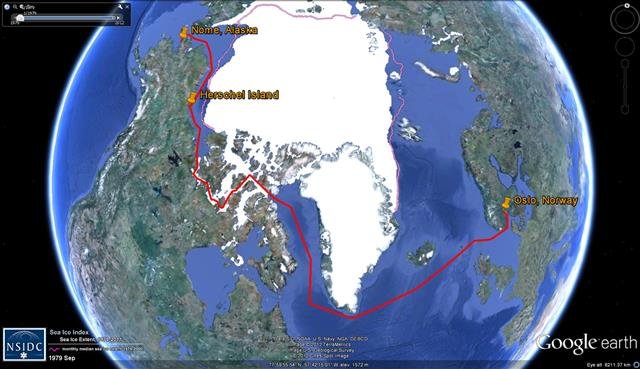
Despite the many attempts of the 19th century British explorers, the first successful, documented voyage through the Northwest Passage didn’t occur until the 20th century, with Roald Amundsen’s 1903-1906 expedition. Amundsen was a Norwegian explorer, who later (1910-1912) led the first expedition to reach the South Pole, and beat by 33 days a rival team of British explorers, led by Robert Scott (Scott’s team tragically died on the way back from the pole, and the scientific observatory at the South Pole is named the Amundsen-Scott Station in honour of both groups).
For his Northwest Passage Expedition, Amundsen left Oslo, Norway on 16 June 1903 in a small fishing boat called the Gjøa with a crew of 6. They travelled via Baffin Bay, Lancaster Sound, Peel Sound, James Ross Strait, Simpson Strait and Rae Strait before having to stop to overwinter at the south of King William Island. In 1904, they travelled to the North Magnetic Pole before returning to King William Island. In the summer of 1905, they sailed through Queen Maud Gulf and continued northwest, until they became trapped in ice near Herschel Island. They completed the voyage the following year, when they reached Nome, Alaska, in September 1906. See here and here.
As can be seen from the map above, much of the route taken by Amundsen and his crew in their 1903-06 expedition was beyond the 1979 satellite sea ice extent.
St. Roch’s 1940-42 and 1944 voyages
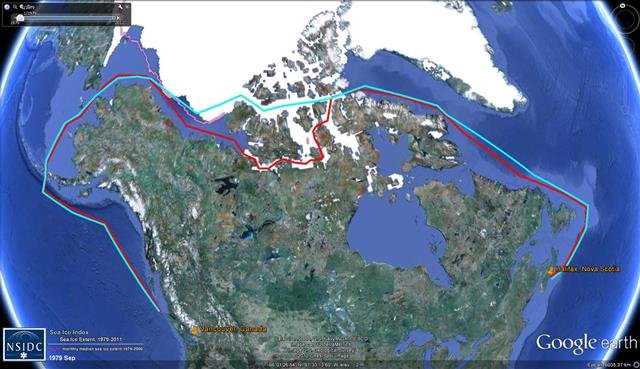
In 1940, under the command of Henry Larsen of the Royal Canadian Mounted Police (RCMP), the St. Roch was given the task of demonstrating Canadian sovereignty in the Arctic, by proving they were able to travel through the Northwest Passage.
In June 1940, it left Vancouver in British Columbia, Canada, and two years later, after making several stops, they reached the other side of Canada, docking in Halifax, Nova Scotia on 11th October 1942. They followed a route similar to the one taken by Amundsen, but in the opposite direction. By doing this, they became the first ship to travel the Northwest Passage from the Pacific to the Atlantic, i.e., from west to east.
Two years later, they received word that they were to attempt the return voyage (east to west) in a more direct manner. They left Halifax on July 22nd 1944, and sailed through the Barrow Strait in a similar route to Parry’s 1819-20 voyage. However, unlike Parry, they weren’t completely stopped by the ice at Melville Island, and were able to continue on through, reaching Vancouver on October 16th – only 86 days after leaving Halifax.
For more details, see here, here, here and here. Also, Larsen provided his account of their voyages in Larsen, 1947 (Abstract).
The Northeast Passage (Russian Arctic)
While much of the interest in Arctic exploration lay in discovering the Northwest Passage, north of Canada, there is also another possible route between Europe and Asia – sailing along the northern coast of Europe and Russia. This possible route is referred to as the “Northeast Passage”, and also held a lot of interest.
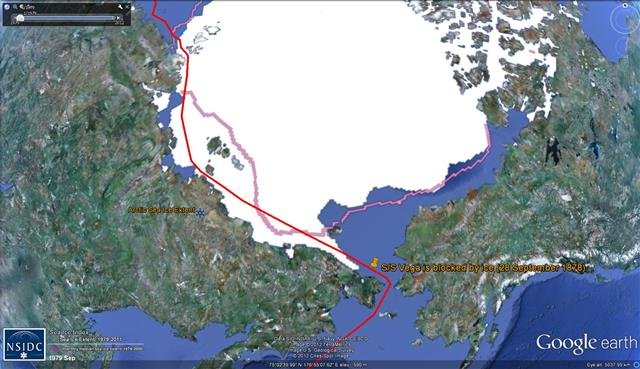
In 1878, Nils Adolf Erik Nordenskiöld led the Swedish steamship, S/S Vega on an expedition to circumnavigate the entire Eurasian continent. They succeeded, and became the first vessel to do so. But, significantly for our discussion, by doing so, they also became the first ship to complete a documented voyage through the Northeast Passage. As can be seen from Figure 12, this is something they probably would have been unable to do in 1979.
In July 1878, the Vega left Göteborg, Sweden and headed northwest around Norway, before starting their eastward journey. Their voyage was relatively straightforward and they had passed the critical Cape Chelyuskin by 19th August. Everything continued to go smoothly, and they had nearly reached the Bering Straits by late September. However, on 28th September, just about one day’s sailing from open water (200km from the Bering Straits), they were blocked by ice. As a result they had to overwinter, and stay moored to the ice until 18th July 1879, when the ice finally freed. Two days later, they were in the Bering Sea, and able to continue their circumnavigation of Eurasia, which they completed on 24th April 1880. For more details, see here, here and McDonald, 1989.
SS Chelyuskin’s voyage, 1933-34
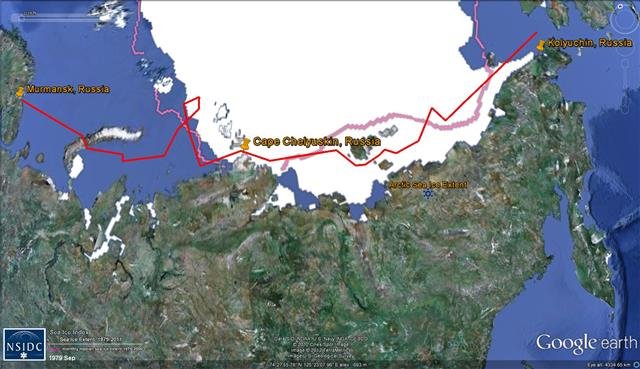
From the early days of the Soviet Union, the development of the Northeast Passage as a “normally operating sea route” was a goal of the government, for both economic and nationalistic reasons. So, in 1932, an icebreaker steamer (the Aleksandr Sibiryakov) was sent along the Passage to prove that it was possible to travel it in one season, under the command of Captain Vladimir Voronin and the leadership of Otto Schmidt. Unfortunately, the Sibiryakov lost its propeller to heavy ice floes. But, nonetheless, it succeeded in reaching the Bering Strait.
So, the following year, it was decided to repeat the experiment, with another ship. The SS Chelyuskin wasn’t an icebreaker. Instead it was just a steamship which had been reinforced to navigate polar ice. But, it was decided to attempt the voyage, anyway. Again under the command of Otto Schmidt and V. Voronin, it left Murmansk in August 1933. Although it had to call upon icebreakers at a few points along the voyage, it managed to reach the mouth of the Bering Strait by September. However, it then became trapped in an expanding icefield. Once trapped, it drifted in ice pack before finally sinking near Kolyuchin Island (in the Chukchi Sea) on 13 February 1934. Even though it sank, the USSR considered the voyage a success, as all but one of the passengers survived and it had proven that a regular steamship had a chance to navigate the whole Northern Maritime Route in a single season. The wreck itself wasn’t located until 2006, however.
The Chelyuskin voyage doesn’t seem to have been a simple voyage, and they had a number of challenging encounters with sea ice, twice getting caught up with drift ice. But, from the map above, it seems that in 1979, sea ice conditions were probably more severe.
For more details, see here and here (in Russian), as well as Barr, 2007a (Abstract) and Barr, 2007b (Abstract).
Nansen’s Fram expedition, 1893-96

Another mission that excited many Arctic explorers was the possibility of physically reaching the North Pole. In July 1893, Fridtjof Nansen led an unusual expedition on the Fram to try and reach the North Pole by deliberately sailing into pack ice, as far north as possible and letting the ship get carried north by drift ice!
By 20th September, they had reached pack ice, but his plan that the ice would continue drifting north failed, and the Fram remained stuck in the ice for more than a year. Believing that the Fram would eventually get carried back home by the drift ice, without reaching the pole, in February 1895, Nansen decided to physically leave the ship with a crewman (Hjalmar Johansen) and continue his expedition with dogs and a sled. They only reached as far as 86°13.6’N, but this was further north than any of his predecessors, so the expedition was a partial success. More importantly, in the context of this post, from the map above, the Fram seems to have managed to get further north in 1893, than he would have if if he had made his voyage in 1979, before getting stuck in the ice.
For more details, see here, here and here.
Dezhnyov’s voyage, 1648
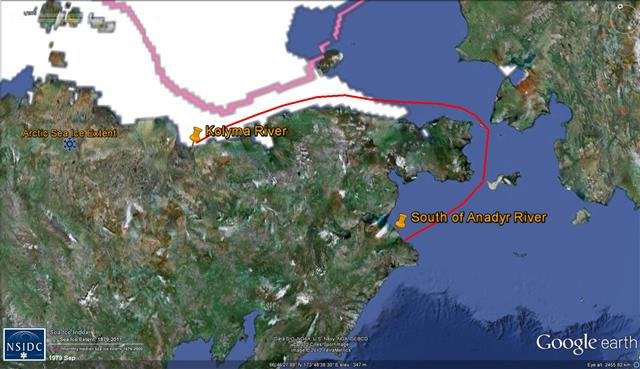
In the 1640s, Russians began hearing of a river in Siberia which flowed into the Arctic and was rich in sable fur, walrus ivory and silver ore. In 1646, one group tried to reach this river, but failed. The next year, Fedot Alekseyev, who was working for a Moscow merchant, organized another expedition. Alekseyev asked Semyon Dezhnyov to join in, because he was a government official. They managed to find the river (Kolyma river), and sailed all the way to the Arctic, but couldn’t get through what is now known as the Bering Strait, because of thick drift ice. They had to turn back.
But, the next year, they tried again. Alekseyev, Dezhnyov and others headed off in June 1648 in a fleet of seven koches. (Koches were a type of Russian sailing ship designed for travelling in Arctic waters.) They soon reached the Arctic, and headed east towards the Bering Strait. However, along the way several of the koches were lost. By September, they had rounded a “great rocky projection”, which was probably the Chukchi Peninsula which is the Russian side of the Bering Straits. But, by then they were down to two koches. Soon after they passed through the Straits, a storm blew up and the koches became separated. Dezhnyov’s koch eventually was wrecked south of the Anadyr, but Dezhnyov and 25 of the crew managed to make it to land.
All in all, the expedition seems to have been fairly disastrous. But, significantly, Dezhnyov’s koch succeeded in travelling from the Kolyma river all the way through the Bering Straits. From the map above, he probably wouldn’t have been able to do that if the ice extent was similar to 1979 conditions.
For more details, see here and here.
Conclusions
It does seem that “since records began”, the Arctic sea ice extent has been gradually, but continuously decreasing. It is true that this is consistent with the idea that there has been continuous global warming, although it is complicated by the fact that the Antarctic sea ice extent still seems to be about the same, i.e., the “global” warming only seems to have affected the northern polar region, not the southern polar region.
However, the problem is that these records only began in October 1978! Fortunately, there are several weather stations from the Arctic region whose records stretch back further. These suggest that the sea ice records coincidentally began just after several decades of cooling in the Arctic had ended! So, if the sea ice records had actually started earlier, they probably would have shown an increasing trend.
Anecdotally, this seems to be confirmed by the fact that many of the early Arctic explorers (early 20th century, 19th century and earlier) were able to reach areas that they probably couldn’t have reached in 1979, when the sea ice records began.
To summarise, the recent decline in Arctic sea ice doesn’t seem to be unusual, or related to human activity. Instead, it seems to be a natural occurrence. The polar bears can breathe a sigh of relief – now, they just need to worry about humans hunting them…
Nice articles, well written and balanced, unlike the hysterical reporting that keeps on comming in ever larger waves. In your conclusion from the article on polar ice you state that Antarctic sea Ice extent has stayed much the same, but if you look at the NSIDC data it has has clearly increased by a very large amount and this year is the largest “since records began”. I wonder if the penguins will manage to get to to sea this year with all those extra miles to trudge across the barren frozen waste ? a picture of this might help to counter the “polar bear on solitary ice flow” that we see so much of.
-Good to see some common sense, I just hope the people who matter listen !
Phil
Thanks for your comment, Phil!
Yes, since we wrote this post in late 2013, the Antarctic sea ice extent has been increasing, and both 2013 and 2014 have had record high extents.
e.g., see this September 2014 NSIDC bulletin.
I was wondering if anyone has studied the effects of all the hundreds of ships and ice breakers that go to the arctic (much fewer in the Antarctic) to study it each spring/summer and make documentaries like the green peace one above. Breaking apart (even the thin) sea ice sheets and allowing the sun to penetrate the dark water and absorb solar radiation where once all that energy was reflected must surely speed up the ice melt (take a look at the track behind the ship in the doco). Even if the total albedo remained the same (highly unlikely) they are allowing heat to be absorbed north of the southern ice extent. Even ignoring solar heating we all know a single large crystal takes a lot longer to dissolve than a powder so breaking up a sheet will hasten it’s dissolution. This would surely be epically ironic if true !